

Choosing the right projection
In this post we will discuss the main projection families, their pros and cons and give some, hopefully useful, hint on how to choose the best projection.
Idealizing the Earth
The Earth is an object with its own shape, but our aim is to map its surface onto a plane, and to do so we must start from a geometrical model of the Earth. The first thing we must do is to define what do we mean by Earth surface, and by this we mean the mean sea level.
The simplest model is of course the perfect sphere, but this is often considered as a too simplistic model, since it does not take into account the Earth deformation due to its rotation around the pole axis.
The model which is nowadays most common is the World Geodetic System 1984, also known as WGS84 or EPSG:4326, where the mean seal level is defined as an ellipsoid having a semi-major axis of 6378.137 kilometers and a semi-minor axis of approximately 6356.752 kilometers.
Latitude and longitude
Let us now recall how latitude and longitude, which are the most common coordinates on both the spherical and on the ellipsoidal Earth, are defined. This will be easier if we first define the great circle, which is any circle given by the intersection of the sphere (the Earth) with a plane going through the center of the sphere.
Great circles are very useful, as the shortest path between two points on the sphere is an arc of great circle1.
We must then define a pole, as an example the North Pole (the South Pole can be defined as the opposite point on the sphere). We then define the equator as the great circle with the greatest distance from the poles or, equivalently, as the great circle defined by the plane perpendicular to the line passing through the poles.
The north/south hemisphere is the surface of the half sphere which has as boundary the equator and encloses the North/South Pole
A parallel is any circle on the sphere given by the intersection of the sphere with a plane perpendicular to the line passing through the poles. The equator is the only parallel which is also a great circle.
We define meridians as the great circles passing through both the poles.
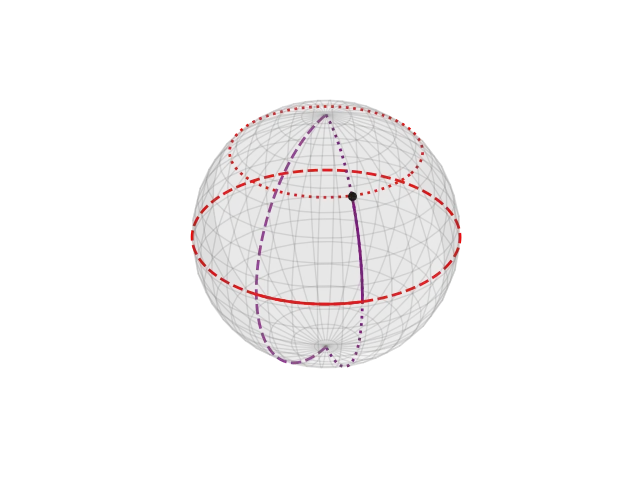
In the above figure we show the meridians and parallels on the sphere, in grey. All meridians encounter at the poles, parallels never encounters. The red dashed line correspond to the equator, the purple dashed line to the Greenwich meridian. The dotted red line is the parallel passing through the black point, the dotted purple line corresponds to the meridian passing through it. The red solid arc corresponds to the point longitude, the purple solid arc corresponds to its latitude.
We must now identify a second great circle passing through both the poles, and this is conventionally defined as the one going through Greenwich.
We can now define the latitude $\phi$ of a point as the shortest arc of meridian going from the equator and the parallel passing through the point. If a point is in the north/south hemisphere, then its latitude is positive/negative (N/S).
The longitude $\lambda$ is the shortest arc of equator going from the Greenwich meridian and the meridian passing through the point. The longitude is positive (East) if, by looking from the North Pole, the shortest arc starting from Greenwich rotates anticlockwise, otherwise it’s negative (West).
Maps and projections
Earth is (almost) spherical, but our screen is flat, so we need to use a projection to map the points on the sphere onto the plane.
The simplest kind of projection we will discuss is the perspective projection, which is obtained by projecting the rays originated by a dummy light source going through the sphere surface onto a plane.
In order to define a projection, we must define
- a projection point, which is the light source
- the surface where we will project the sphere
Common projection points are:
- the center of the sphere (central)
- a point onto the sphere - usually a pole
- a point located at infinite distance from the sphere and the rays are parallel lines (orthographic)
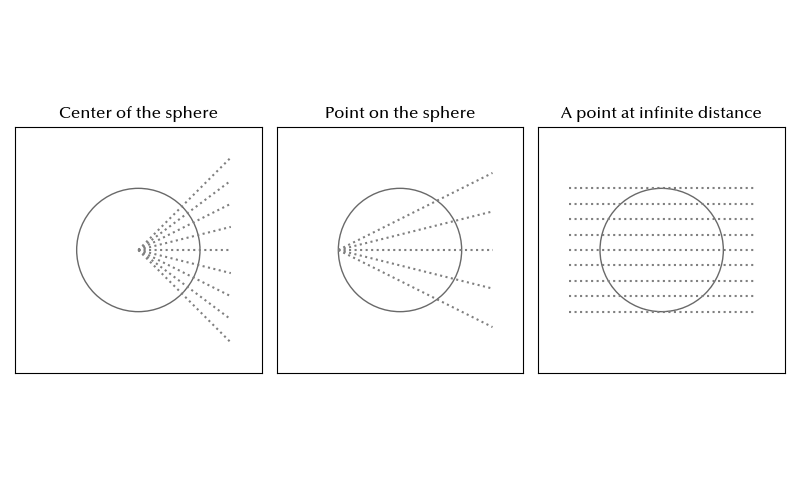
We must also choose the plane where we want to project the sphere. Common choices are
- a plane tangent to a point, usually the pole (planar)
- a cone tangent to any given circle, usually parallel (conic)
- a cylinder tangent to any great circle, usually the equator (cylindrical)
Planar and cylindrical projections can be considered special cases of the conical one.
In any polar projection, parallels are mapped onto circles, while meridians are straight lines starting from the pole.
Some common projections are:
- the gnomonic, the planar perspective projection where the rays start from the center of the sphere
- the stereographic projection, the planar perspective projection where the rays start from the point opposite to the point of the sphere tangent to the projection plane
- the orthographic projection, the planar perspective projection where the rays are parallel
- the central cylindrical projection
Here we show how equidistant parallels and meridians are mapped for the above projections
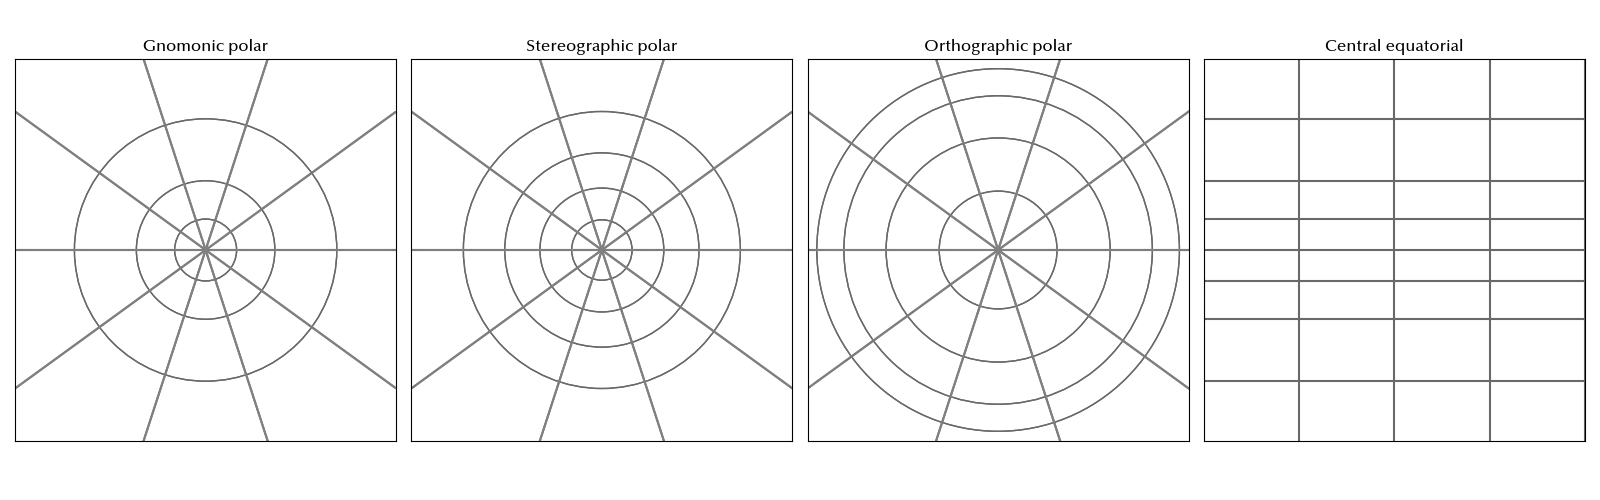
It is sometimes useful to use a secant plane rather than a tangent one, but here we only focus on tangent projections.
Each projection has pros and cons, as usual. As an example, in the gnomonic projection, arcs of great circles are always mapped onto straight lines, making them convenient to trace routes. However, in this projection, distances and areas are distorted, and the more one goes far from the center of the projection (where we assume the plane touches the sphere), the worst becomes the distortion.
On the other hand, the central cylindrical projection is well suited to show regions close to the equator, but the poles are mapped at the infinity.
Finally, the stereographic projection is a conformal projection, and this means that angles are locally preserved in the mapping, so shapes are preserved too. This makes them suitable to calculate angle differences.
Conformal projections form a very important class of projections, and the stereographic projection is only one of these projections. Other well known examples of conformal projections are the Mercator projection, which is a conformal projection derived from the cylindrical projection, and the Lambert conical projection, which is instead derived from the central conical projection.
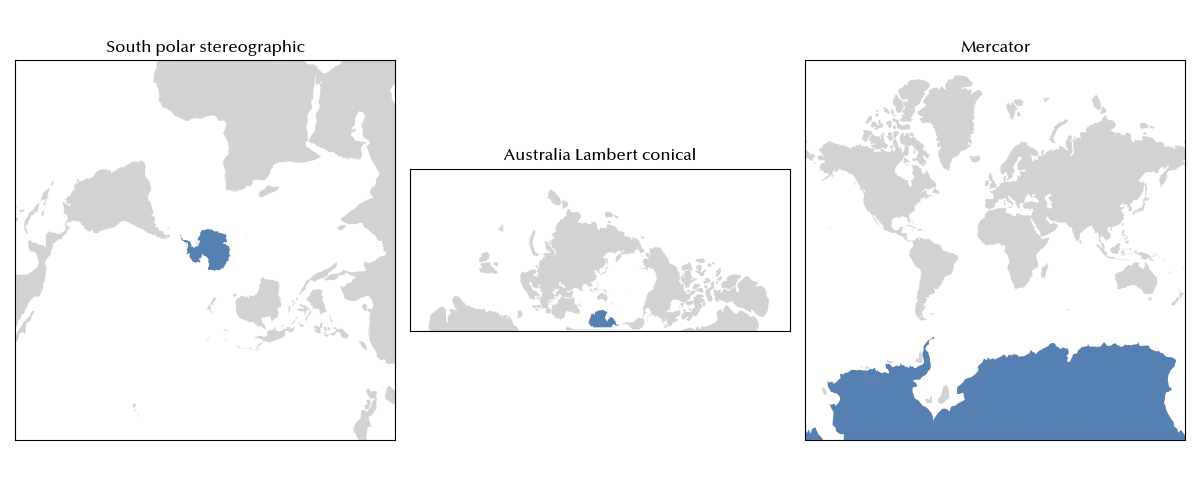
In the above figure we show how the South Pole, in blue, is mapped for different conformal maps.
Another very important class of projection is the family of equal-area projections. In equal-area projections, the ratio between areas is preserved.
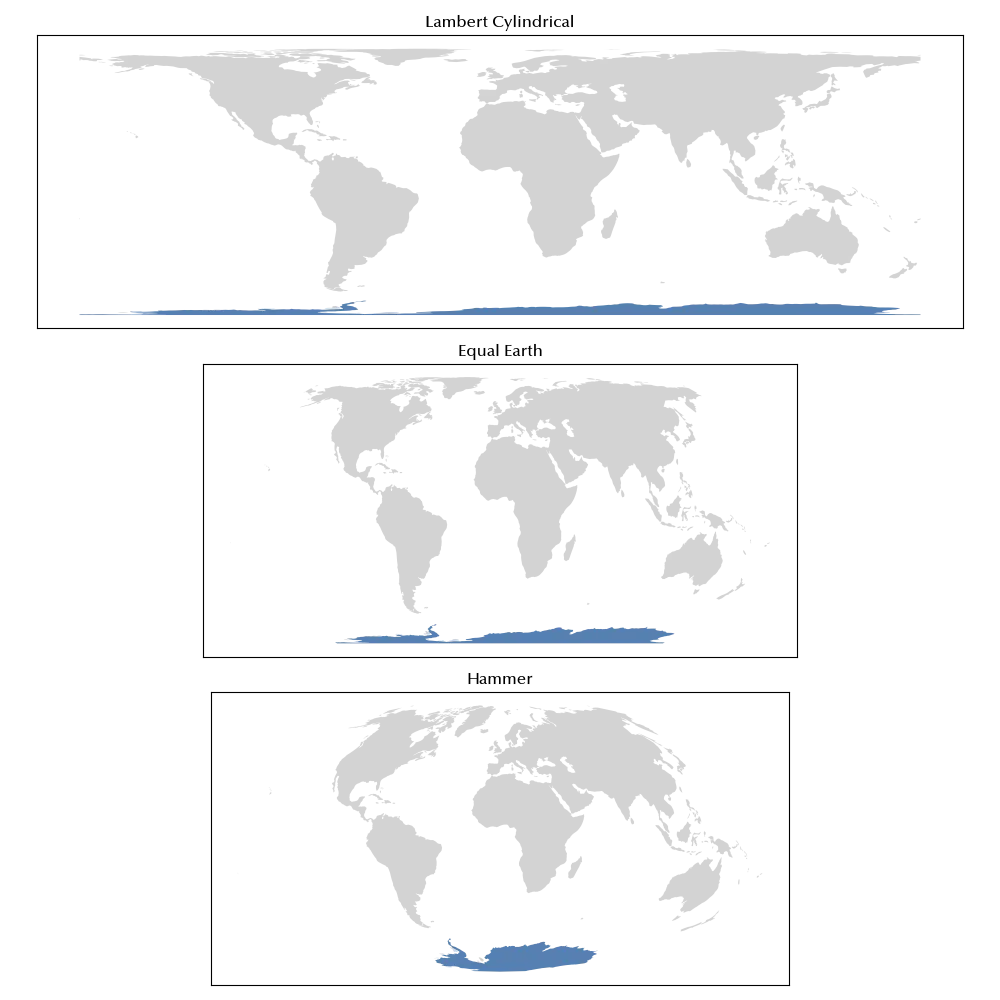
Due to this property, equal area projections are often used in statistics, where one wants to compare quantities for different countries and relate these quantities to the extension of the country itself. Above, we show some example of equal-area projection, namely the Lambert conical, the Equal Earth and the Hammer projections.
We also mention the equidistant projections, which preserve some distance, usually distances from one point or along one axis. As an example, the equirectangular projection preserves the distances along meridians, while the azimuthal equidistant projection preserves distances from the central point. Another equidistant projection you might easily encounter is the equidistant conic projection, which both preserves distances along meridians and along the two standard parallels (in the figure 0 and -40 degrees). The equidistant projection having as standard parallel the equator is also known as plate carrée.
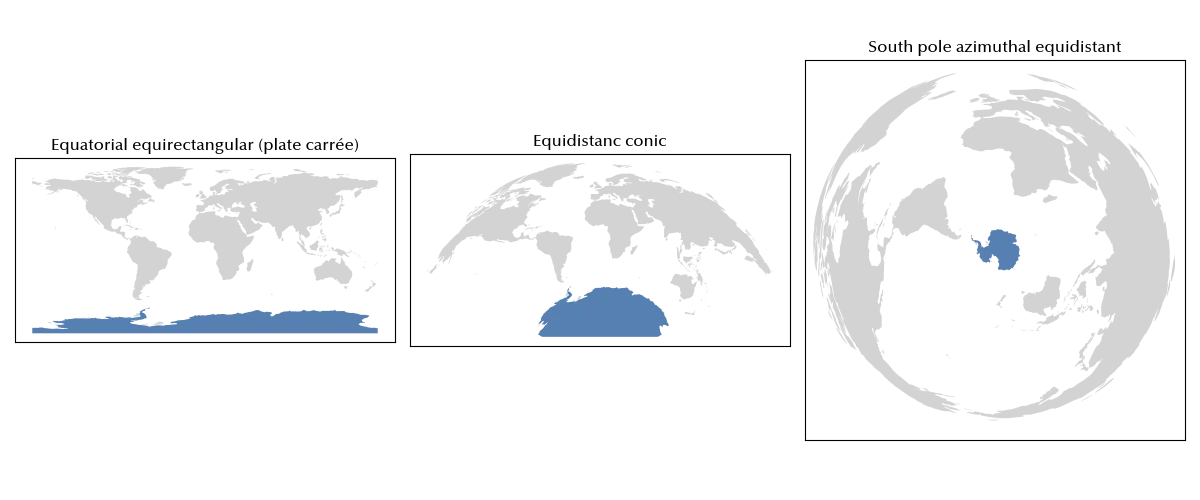
This class of projections can be useful when you need to precisely map distances, and are therefore often used when analyzing routes.
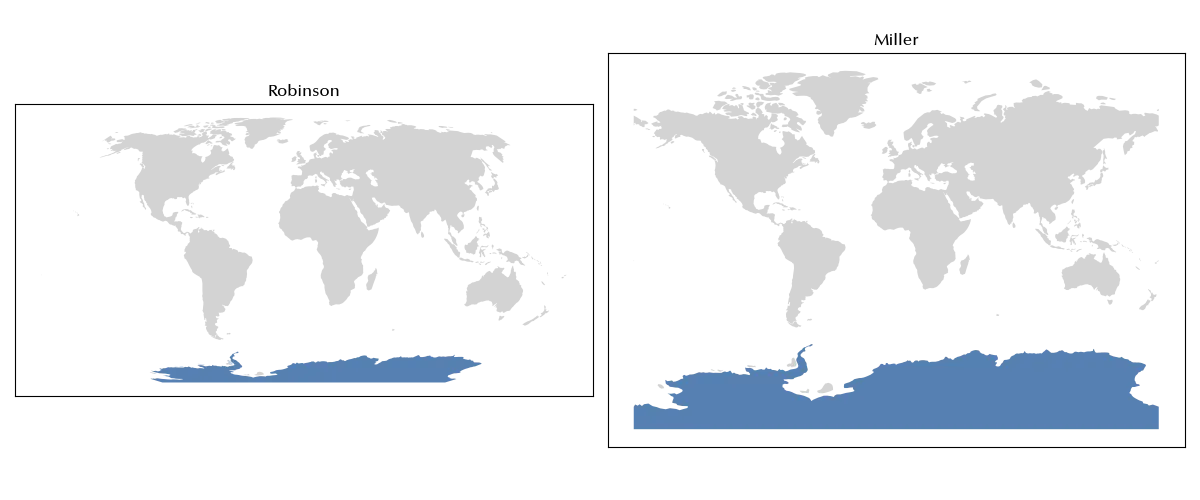
A separate class of projections is given by the compromise projections, which are nor equal-area neither conformal or equidistant, but rather seek for balance in the various kinds of distortions. This is a very large family of projections, and examples of compromise projections are the Robinson projection or the Miller projection.
Conclusions
Choosing the appropriate projection is crucial to convey the most relevant information, especially when you need to visualize large geographical areas. There exists no perfect projection, and each projection has pros and cons, it is therefore important both to have some basic repertoire of projections and to experiment with different projections. As usual, drawing is re-drawing.
-
This is why, for long distances, it is convenient to work with nautical miles, which are defined as the length of one prime of degree of the great circle. ↩