Bonus: counting animals in a park
In this post we will discuss a model which is quite unknown outside from the ecological scientific community. This model is used to estimate the number of individuals of a given specie. When dealing with wild animals, a complete census of the number of individuals is generally unfeasible, since wild animals are usually good at hiding. However, this method allows you to estimate the total number of individuals.
The hypergeometric distribution
Let us consider an urn containing $N$ balls. $n$ balls are red, while $N-n$ balls are blue. Let us now assume that we extract $K$ balls out of the urn without re-introducing them in the urn. What is the probability that we extract $k$ red balls? We will associate the extraction of a red ball with a success (x=1) while the extraction of a green ball will be associated with a failure (x=0).
The probability of $k$ successes out of $K$ samples is given by
\[P(x=k | N, n, K) = \frac{\binom{n}{k} \binom{N-n}{K-k}}{\binom{N}{K}}\]The capture-mark-recapture method
Let us now assume that we must count the number of individual of a certain specie into a park. We go to the park, and we manage to capture $n$ individuals. We then mark them, and re-introduce them into the park.
After some time, we get back to the park and randomly capture other $K$ individuals. We observe that $k$ of the individuals are marked. Assuming that the total number of individuals is unchanged, we can now estimate the total number of individuals $N$, since we know that the number of marked captured individuals $k$ is distributed according to the hypergeometric distribution.
In order to apply the above method, let us consider the saddleback experiment discussed in this article. In the experiment, the authors captured and marked 100 saddlebacks. After one week, they captured 60 individuals, and 40 of them were marked.
We will perform a Bayesian estimate for the total number of individuals. We will assume an uninformative prior for the total number of individuals, namely a geometric distribution with $p=0.001$.
import pymc as pm
import arviz as az
import numpy as np
from matplotlib import pyplot as plt

rng = np.random.default_rng(42)

with pm.Model() as cmr_model:
    nest = pm.Geometric('nest', p=0.001)
    k = pm.HyperGeometric('k',  n=100, k=60, N=nest, observed=np.array([40]))
    idata = pm.sample(random_seed=rng, draws=5000, tune=5000)

az.plot_trace(idata)

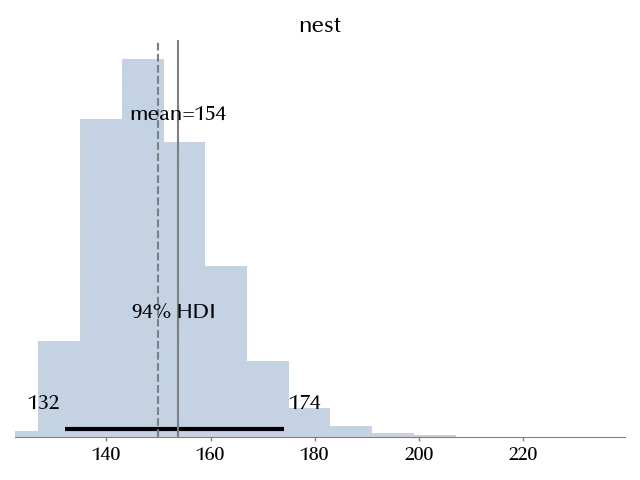
The trace seems ok, we can now compare our estimate with the one provided in the article:
\[N_{est} = \frac{n \times K}{k} = \frac{100 \times 60}{40}=150\]fig = plt.figure()
ax = fig.add_subplot(111)
az.plot_posterior(idata, ax=ax)
ax.axvline(x=100*60/40, color='grey', ls='--')
ax.axvline(x=idata.posterior['nest'].mean(dim=('draw', 'chain')).values, color='grey')
fig.tight_layout()

The classical estimate, of course, closely resembles our estimate. We can however provide the full probability distribution of the number of individuals, and our method can be easily extended to allow for migration, birth or death of individuals.
Conclusions
We introduced the hypergeometric distribution, and we have seen how to use this distribution to estimate the number of individuals in a capture-mark-recapture experiment.
%load_ext watermark
%watermark -n -u -v -iv -w -p xarray,pytensor
Python implementation: CPython
Python version : 3.12.7
IPython version : 8.24.0
xarray : 2024.9.0
pytensor: 2.25.5
arviz : 0.20.0
pymc : 5.17.0
matplotlib: 3.9.2
numpy : 1.26.4
Watermark: 2.4.3
